 |
Name Description Diagram Example
|
|
|
|
Name Description Diagram Example
 Explanatory sequential design
Collection and analysis of quantitative data followed by the collection and analysis of qualitative data in order to elaborate or explain the quantitative findings.
Heap (2010)
 (see Case Study 2)
Embedded design
Either the quantitative or qualitative component can take priority, but the work draws on both approaches.
Can be simultaneous or sequential. Typically used when quantitative or qualitative alone is felt insufficient for understanding the phenomenon of interest, and the supplementary component is used to buttress the dominant component.
Best et al. (2016)

 (adapted from Bryman, 2016: 638-9)
 |

COMBINING MIXED METHODS RESEARCH
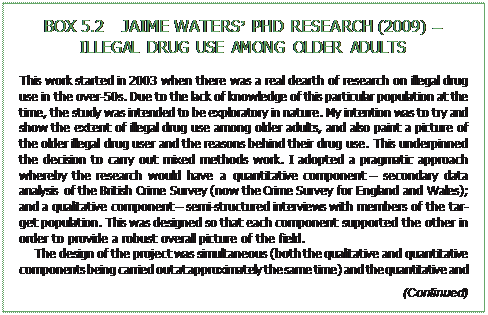
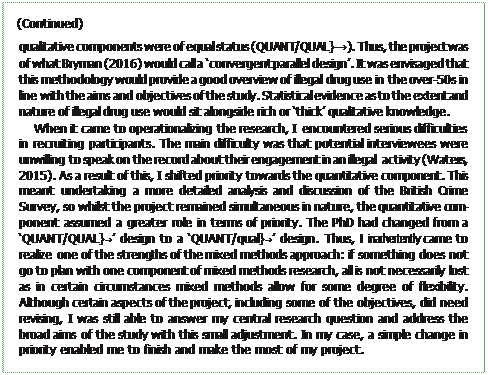
The process of combining quantitative and qualitative results is perhaps one of the most challenging aspects of mixed methods research, particularly because this is often rooted in the philosophical approach adopted by the researcher, and linked to the overarching rationale for undertaking mixed methods research in the first place. Ultimately, how you intend to combine the results is something to consider when designing your mixed methods research project, in a similar way to how you would think about the type of analysis you are going to use for each component, although, due to the complexities and realities of real-world research, these intentions may have to be revised according to the prevailing circumstances, as illustrated in Box 5. 1.
The ‘mixing’ in mixed methods
Fundamentally, the process of combining results from the quantitative and qualitative components of data collection is about examining the sets of results and discerning how they can contribute to answering the central research question(s). In mixed meth- ods research, this process creates two types of findings that transcend the quantitative/ qualitative divide, which have been defined by Teddlie and Tashakkori (2009) as:
·  inferences – the conclusions and interpretations from each component (quantita- tive or qualitative) of a mixed methods research project
·  meta-inferences – the conclusions and interpretations drawn across the quantita- tive and qualitative components.
As mixed methods research has developed as a research strategy, the way in which meta-inferences are generated has evolved over time. This is contested terrain and numerous scholars have proposed different ways to combine quantitative and quali- tative results (see Bryman, 2016: 641). You may also find that some researchers refer to this part of the process as the ‘point of interface’ (Morse and Niehaus, 2009). Bryman (2006) conducted a content analysis of mixed methods research studies and found that 16 different approaches had been used. Weighing up the merits of 16 dif- ferent approaches to the combining of results is a heavy burden for those new to mixed methods research. However, Greene et al. (1989), on the basis of an analysis of 57 mixed methods research studies, suggest five ways that findings from each component can be combined: triangulation, complementarity, development, initia- tion and expansion. This serves as a very useful starting point when considering how to ‘mix’ your results:
|
|
|
 Triangulation is where two or more methods are used to investigate the same phenomenon. The aim is to seek a convergence and corroboration of the infer- ences generated from each research component. For example, Maruna and King (2009) used three components (QUANT→ QUAL→ QUANT) to triangulate public perceptions about the ‘redeemability’ of offenders. The data was col- lected as part of the Cambridge University Public Opinion Project, which investigated public attitudes towards justice. The first component involved a postal survey (QUANT) of British households, which measured punitiveness. This was followed by exploratory interviews (QUAL) to understand percep- tions of punishment and, finally, a series of small experiments (QUANT) to determine if punitive attitudes could be manipulated.
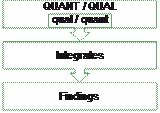
 Complementarity is where two or more methods are used to investigate distinct, albeit often overlapping, aspects of a phenomenon. This contrasts with triangu- lation and focuses on enhancing the meaningfulness of the meta-inferences generated. Greene et al. (1989: 258) suggest that complementarity provides an ‘enriched, elaborated understanding of the phenomenon’. For example, Waters (2009) used secondary data analysis of the British Crime Survey (now the Crime Survey for England and Wales) (QUANT) to look at the demo- graphics of drug users aged over 50, and semi-structured interviews (qual) to understand their motivations and attitudes towards the use of illegal drugs (QUANT/qual}→ ).
 Development is a technique of mixed methods research involving the employ- ment of a sequential design, with the inferences drawn from the first component
used to help inform the development of the second component. This approach is employed to increase the robustness of the findings and any concepts gener- ated as a result. For example, Best et al. (2016) started with a survey (QUANT) that collected data about participants’ substance use and recovery. This baseline data then informed the development of interviews (QUAL), which together evaluated a programme designed to help people discontinue their heroin use (QUANT→ QUAL).
 Initiation refers to mixed methods research where new perspectives or para- doxes emerge. This may not have been the purpose of the mixed methods design, but the inferences generated from each component of the research allow for further analysis to be undertaken to create new knowledge and ideas. For example, Platts-Fowler and Robinson (2015) evaluated the Gateway Protection Programme, which used interviews and focus groups with refugees (qual) to inform and develop three waves of a longitudinal survey (QUANT), based on newly discovered perspectives (qual→ QUANT→ QUANT→ QUANT).
 Expansion utilizes mixed methods research to provide breadth and depth to a study. For example, the distinct components of a single project might collect data about different aspects of a topic. This approach reflects the philosophi- cally pragmatic notion of selecting the most appropriate tool for the job at hand. For example, Heap (2010) used a postal survey (quant) to measure pub- lic perceptions of anti-social behaviour, which then informed public focus groups (QUAL) and semi-structured interviews (QUAL) with anti-social behav- iour practitioners (quant→ QUAL/QUAL).
|
|
|
Aside from triangulation, which is narrowly concerned with exploring one phenom- enon, the other types of mixed methods research elaborated by Greene et al. (1989) can be used quite flexibly and often in combination, allowing for some quite sophis- ticated ‘mixing’ of results (see Box 5. 2 on Heap’s PhD). This possibility should be considered at the design stage, but it can also emerge as the research project develops through the process of data collection and analysis.
 |

public perceptions of anti-social behaviour (ASB), as perceptions were used at that time as the proxy measure to determine the extent of ASB (the police now record incidents too). I was also tasked with exploring the variations in perceptions between different localities and investigating the different methods used by practitioners to reduce public perceptions of high levels of ASB in local areas, meaning I had three research questions to answer. Like many externally funded projects, my funder knew what they wanted and it was my job as the researcher to make the project work. As a result, I adopted a pragmatic approach to the research (both literally and philosophically).
I undertook an explanatory sequential mixed methods design, starting with a quantitative component to identify important themes (a public perception question- naire), followed by two qualitative components to investigate in some detail the themes that were generated (focus groups with members of the public and inter- views with ASB practitioners). The qualitative components were prioritized within my project because of the depth and originality they provided (quant→ QUAL/QUAL). Also, my own small-scale questionnaire was not going to replicate the British Crime Survey (now the Crime Survey for England and Wales).
Component one involved collecting quantitative data, through a questionnaire, to measure public perceptions of ASB in the eight study areas. Due to concerns about respondents having access to the internet, I conducted a postal survey, sending out 500 questionnaires per study area. I posed mainly closed questions, with some core ASB perception questions that featured in the British Crime Survey, as well as new questions to investigate the drivers of perceptions. I did not expect a high response rate, despite including a pre-paid return envelope and offering respondents entry into a prize draw for completion. I was right to be cautious, with 422 usable ques- tionnaires returned, a response rate of 10. 6%. At the time I was disappointed, but the mixed methods design and the priority of the qualitative components meant this was not too much of a problem. The 422 responses were enough to conduct a logis- tic regression analysis in SPSS and generate the themes to be explored qualitatively (just not quite enough to obtain 50: 50 variability and a 95% confidence level). Logistic regression is a predictive model used to explain the relationship between a dichotomous (two category) variable and one or more independent variables. For example, the analysis discovered that respondents who perceived ASB to be com- mitted deliberately (opposed to thoughtlessly) were three times more likely to perceive high levels of ASB in their local area.
Components two and three were conducted simultaneously. Component two, focus groups with the public, was problematic. My aim was to conduct two focus groups per area (16 overall). The biggest hurdle was accessing people who would talk to me. In the end, I conducted ten focus groups, involving a total of 68 partici- pants. Component three involved interviewing ASB practitioners from the police, registered providers of social housing, and both strategic and frontline officers from
|
|
|
(Continued)

|
|
|


