 |
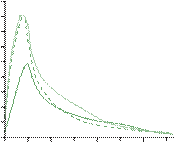
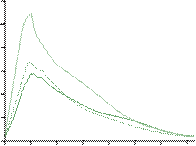
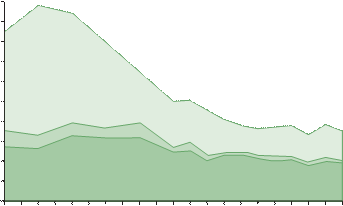
Property crime. Violent crime. (age-specific arrest rates). Per cent change in property crime arrest rates 1988–2010. Per cent change in violent crime arrest rates 1994–2010
|
|
|
|
a
 4000
4000
Property crime
 (age-specific arrest rates)
11 18 25 32 39 46 53 60
 Age
Age
a
 1000
1000
Violent crime
(age-specific arrest rates)
 |
11 18 25 32 39 45 53 60
 Age
Age


b
 40
40
–20
–40
–60
–80
Per cent change in property crime arrest rates 1988–2010
b

 20
20
 –10
–10
–20
–30
–40
–50
–60
–70
Per cent change in violent crime arrest rates 1994–2010

 Age Age
FIgure 10. 5 Changing arrest patterns associated with the crime drop, US Source: Farrell et al (2015).
Data signatures and alternative explanations of the crime drop
A range of explanations has been proposed for the international crime drop. These have included, for example, changes in policing, increased imprisonment, legislation making abortion easier, changes in the economy, changing drug-taking patterns, immigration, removal of lead from the atmosphere, and processes of civilization (Farrell, 2013; Farrell et al., 2014). In looking at these critically, we have asked
 50
50
 45
45
 0
0
 |


 Year
Year
FIgure 10. 6 Forced and unforced entry for burglary with entry, CSEW 1992-2011/12
Source: Farrell et al. (2016).
whether they are consistent with the known data signatures of crime trends and the international crime drop. Several quickly fell by the wayside, given their failure to accord with the varying times of the crime drop, their failure to make sense of the prior crime rise, their failure to explain the property as well as violent crime drop, their failure to explain the specific crime rises that have occurred alongside the crime drops and their failure to make sense of the international range of the crime drops. Although in these cases we have not reconstructed the theories to work through their specific predictions, we have asked whether the explanations are consistent with the patterns associated with the crime drop. We have repeatedly found that the security hypothesis outperforms other explanations in explaining known features of the crime drop. Of course, disproving other hypotheses does not make the security hypothesis correct, but we think it is important to rule out other plausible alternative explanations.
Describing and deconstructing the crime drop
Although we have produced a substantial volume of research exploring data relating to the security hypothesis (some 33 papers at the time of writing), we acknowledge
|
|
|
that there are many remaining gaps in evidence relating to the crime drop and its explanation.
The following research remains to be done:
a. testing the security hypothesis in more jurisdictions where the crime drop has occurred
b. testing the security hypothesis in jurisdictions where there has been no crime drop c. testing the security hypothesis as it relates to a broad range of offences, for exam-
ple shop theft, robbery, child sexual abuse and homicide
d. describing the changing patterns of criminal involvement associated with the crime drop across jurisdictions where the crime drop has occurred
e. describing the crime drop in terms of prevalence and incidence rate changes, using capped and uncapped estimates of incidence by crime type
f. describing the sequencing of crime drops by crime type within jurisdictions and between jurisdictions.
SUMMARY AND REVIEW
The international crime drop, as indicated from both victimization survey data and recorded crime data, came as a surprise to criminologists as well as the general pub- lic. Understanding it poses a major puzzle for criminology. Its explanation clearly has major potential to inform public policy: if we can understand what produced the crime drop, we may learn better how to maintain or extend it where drops have not yet occurred, and how to reduce crimes that are rising. Conducting research on the scale (how much crime has dropped), extent (the range of jurisdictions and crime types), nature (timing, prevalence, incidence, offender involvement, locations, etc. ) and possible explanations for the crime drop requires the use of the best data avail- able. In this chapter, we show how we have made extensive, although not exclusive, use of victimization surveys to test the ‘security hypothesis’, according to which a major cause of the falls in crime lies in widespread improvements in security. We conclude that our quantitative data ‘signatures’ of the crime drop are consistent with the effects of security but not with other explanations.
We have shown, in this chapter, how and why repeated, large-scale and high-
quality victimization surveys provide an invaluable resource for identifying crime patterns and testing hypotheses that might explain them. Research using victimiza- tion surveys is not easy. Moreover, the data are imperfect (as is always the case). Victimization surveys provide, however, by far the most robust data source available for identifying crime patterns and trends. With some imagination and quite a lot of effort, we were able to make secondary use of the data systematically to test the hypotheses in which we were interested. We were able to analyse the data in ways not envisaged by the survey’s architects. We think that large-scale victimization
surveys that are professionally undertaken at public expense provide quantitative material that is fundamental for identifying and analysing crime patterns. We also think that victimization survey data are underused (see Tseloni and Tilley, 2016). Because of some limitations in victimization survey data, where possible, of course, we also made use of other sources to corroborate out findings.
There is scope for further research on the international crime drop. This could take any of several forms. One could be that of trying to develop alternative explana- tions that improve on or refine those offered so far. Another could be that of testing existing explanations, including that relating to security, more fully in jurisdictions where there are the required data and where research has not yet been undertaken. A third could include more detailed descriptions of the crime drop in terms of offending, victimization, location and crime type patterns, in particular in jurisdic- tions where no such research has yet been undertaken. A fourth could be the identification of crime rises occurring amongst the crime falls in an effort to work out what is leading those crimes to increase and to determine whether similar offend- ers to those associated with crimes that have fallen are or are not involved in them. Although there may be scope for some qualitative research in understanding the crime drops, it is clear that quantitative work will be crucial.
|
|
|
 |  | ||
 SUGGESTIONS FOR FURTHER READING
There is a growing literature describing the international crime drop, and attempting to explain it. Two important recent edited collections are:
Tonry, M. (2014) Why Crime Rates Fall and Why they Don’t. Crime and Justice 43. Chicago: University of Chicago Press; and van Dijk, J., Tseloni, A. and Farrell, G. (2012) The International Crime Drop. Basingstoke: Palgrave. The chapter by Farrell, Tilley and Tseloni (‘Why the crime drop? ’, pp. 421–90) in Tonry’s collection critically examines pro- posed explanations for the crime drop and argues that all but the security hypothesis fail crucial tests.
The use of data signatures in testing hypotheses is explained and exemplified in: Farrell, G., Tseloni, A. and Tilley, N. (2016) ‘Signature dish: triangulation from data signatures to examine the role of security in falling crime’, Methodological Innovations, 9: 1–11.
A detailed account of and rationale for the Security Impact Assessment Tool is presented in: Farrell, G., Tseloni, A. and Tilley, N. (2011) ‘The effectiveness of vehicle security devices and their role in the crime drop’, Criminology and Criminal Justice, 11(1): 21–35.
A step-by-step example of how to calculate victimization rates (prevalence, incidence, repeat victims, repeat crimes and crime concentration) is given in:
Tseloni, A. (2014) ‘Understanding victimization frequency’, Chapter 127 in G. Bruinsma and
 D. Weisburd (eds), Encyclopaedia of Criminology and Criminal Justice (ECCJ). New York: Springer-Verlag, pp. 5370–82.
 Farrell, G. (2013) ‘Five tests for a theory of the crime drop’, Crime Science, 2(5): 1–8. Farrell, G. (2016) ‘Attempted crime and the crime drop’, International Criminal Justice
Review, 26(1): 21–30.
Farrell, G. and Pease, K. (2007) ‘The sting in the tail of the British Crime Survey’, in
M. Hough and M. Maxfield (eds), Surveying Crime in the 21st Century. Crime Prevention Studies, Vol. 22. Monsey, NY: Criminal Justice Press, pp. 33–53.
Farrell, G., Laycock, G. and Tilley, N. (2015) ‘Debuts and legacies: the crime drop and the role of adolescence-limited and persistent offending’, Crime Science, 4(16): 1–10.
Farrell, G., Tseloni, A., Mailley, J. and Tilley, N. (2011a) ‘The crime drop and the security hypothesis’, Journal of Research in Crime and Delinquency, 48(2): 147–75.
Farrell, G., Tseloni, A. and Tilley, N. (2011b) ‘The effectiveness of vehicle security devices and their role in the crime drop’, Criminology and Criminal Justice, 11(1): 21–35.
Farrell, G., Tseloni, A. and Tilley, N. (2016) ‘Signature dish: triangulation from data signa- tures to examine the role of security in falling crime’, Methodological Innovations, 9: 1–11.
Farrell, G., Tilley, N. and Tseloni, A. (2014) ‘Why the crime drop? ’, in M. Tonry (ed. ), Why Crime Rates Fall and Why they Don’t. Crime and Justice 43. Chicago: University of Chicago Press, pp. 421–90.
|
|
|
Fujita, S. and Maxfield, M. (2012) ‘Security and the drop in car theft in the United States’, in J. J. M. van Dijk, A. Tseloni and G. Farrell (eds), The International Crime Drop: New Directions in Research. London: Palgrave Macmillan.
Osborn, D. R. and Tseloni, A. (1998) ‘The distribution of household property crimes’,
Journal of Quantitative Criminology, 14: 307–30.
Piquero, A. R., Hawkins, D., Kazemian, L. and Petechuk, D. (2014) Bulletin 2: Criminal Career Patterns. Washington, DC: Office of Juvenile Justice and Delinquency Prevention. Svensson, R. (2002) ‘Strategic offences in the criminal career context’, British Journal of
Criminology, 42(2): 395–411.
Tilley, N. (1993) Understanding Car Parks, Crime and CCTV: Evaluation Lessons from Safer Cities. Crime Prevention Unit Paper No. 42. London: Home Office.
Tilley, N., Farrell, G., Grove, L., Thompson, R. and Tseloni, A. (2015) ‘Do burglar alarms increase burglary risk? A counterintuitive finding and possible explanations’, Crime Prevention and Community Safety, 17(1): 1–19.
Tseloni, A. and Tilley, N. (2016) ‘Choosing and using statistical sources in criminology: what can the Crime Survey for England and Wales tell us? ’, Legal Information Management, 16: 78–90.
Tseloni, A., Mailley, J., Farrell, G. and Tilley, N. (2010) ‘The cross-national crime and repeat victimization trend for main crime categories: multilevel modeling of the International Crime Victims Survey’, European Journal of Criminology, 7(5): 375–94.
Tseloni, A., Thompson, R., Grove, L., Tilley, N. and Farrell, G. (2017) ‘The effectiveness of burglary security devices’, Security Journal, 30(2): 646–64.
van Dijk, J. and Tseloni, A. (2012) ‘Global overview: international trends in victimisation and recorded crime’, in J. van Dijk, A. Tseloni and G. Farrell (eds), The International Crime Drop: New Directions in Research. Basingstoke: Palgrave Macmillan, pp. 11–36.
|
|
|


