 |


CTG: Interpretation. To interpret a CTG you need a structured method of assessing its various characteristics. The most popular structure can be remembered using the acronym
|
|
|
|
CTG: Interpretation
For interpretation of CTG a structured method of assessing its various characteristics is used.
To interpret a CTG you need a structured method of assessing its various characteristics.
The most popular structure can be remembered using the acronym
DR C BRAVADO
DR – D efine R isk
C –Contractions
BRa – B aseline Ra te
V – V ariability
A – A ccelerations
D – D ecelerations
O – O verall impression
DR – D efine R isk
First need to assess if this pregnancy is high or low risk.
Reasons a pregnancy may be considered high risk are shown below:
• Maternal medical illness
• Gestational diabetes
• Hypertension
• Asthma
Obstetric complications
• Multiple gestation
• Postdate gestation
• Previous cesarean section
• Intrauterine growth restriction
• Premature rupture of membranes
• Congenital malformations
• Oxytocin induction/augmentation of labour
• Pre-eclampsia
Other risk factors
• Absence of prenatal care
• Smoking
• Drug abuse
C– Contractions
Record the number of contractions present in a 10 minute period – e. g. 3 in 10 (Fig. 72)
Each big square is equal to 1 minute, so look at how many contractions occurred within 10 squares.
Individual contractions are seen as peaks on the part of the CTG monitoring uterine activity.
The following characteristics should be assessed:
• Duration – how long do the contractions last?
• Intensity – how strong are the contractions? (assessed using palpation)
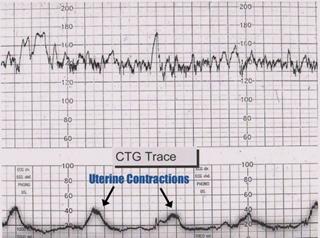
Fig. 72. There are 2-3 contractions in a 10 minute period – e. g. 3 in 10
BRa– Baseline Rate of the fetal heart
The baseline rate is the average heart rate of the fetus in a 10 minute window. A normal fetal heart rate is between 120-160 bpm (Fig. 73)
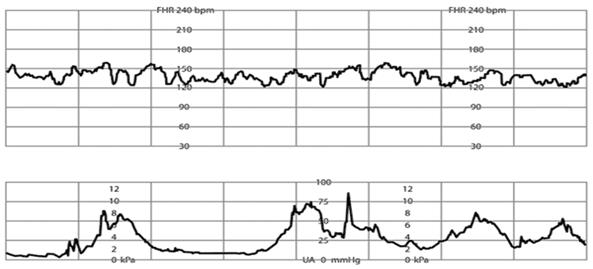
Fig. 73. Normal baseline fetal heart rate (FHR), shown at 135 beats per minute (bpm). Normal baseline rate ranges from 110 to 160 bpm for a 10-minute segment.
Abnormal baseline is termed tachycardia when the baseline FHR is greater than 160 bpm, it is termed bradycardia when the baseline FHR is less than 110 bpm.
Fetal tachycardia
Fetal tachycardia is defined as a baseline heart rate greater than 160 bpm. It can be caused by: • Fetal hypoxia • Chorioamnionitis – if maternal fever also present • Hyperthyroidism • Fetal or maternal anaemia • Fetal tachyarrhythmia Fetal bradycardia
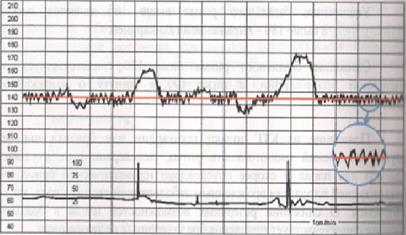
Fetal bradycardia is defined as a baseline heart rate less than 120 bpm. Mild bradycardia of between 100-120 bpm is common in the following situations: • Postdate gestation • Occiput posterior or transverse presentations • Severe prolonged bradycardia (< 80 bpm for > 3 minutes) indicates severe hypoxia. Causes of prolonged severe bradycardia are: • Prolonged cord compression • Cord prolapse • Epidural & spinal anaesthesia • Maternal seizures • Rapid fetal descent V – Variability of baseline FHR The FHR is under constant variation from the baseline. Baseline FHR variability is a term that is used to describe the variations in the FHR. Baseline FHR variability is a product of integrated activity between the sympathetic and parasympathetic branches of the autonomic nervous system. Baseline FHR variability, therefore, reflects the status of the central nervous system (CNS). Variability of FHR baseline refers to the normal beat to beat changes in FHR. Normal variability is between 5-15 bpm. Variability can be measured by analysing a one-minute portion of the CTG trace and assessing the difference between the highest and lowest rates during that period. This variability reflects a healthy nervous system, chemoreceptors, baroreceptors and cardiac responsiveness. Variability should be normal after 32 weeks. When assessing the heart rate of a fetus, we want to see some variability, because variability is a sign that the baby is moving around and is well. Moving around, such as kicking, increases heart rate, because movement increases oxygen demand. In order for the body to meet this oxygen demand caused by movement, it must pump blood through the body quicker. The body does this by increasing the heart rate, so oxygen can be pumped more efficiently through the body. Thus, variability reflects a healthy nervous system, chemoreceptors, baroreceptors and cardiac responsiveness. Factors that could decrease variability include fetal sleep, narcotics, or other sedative drugs, alcohol and other illicit drugs, fetal sepsis, fetal tachycardia, gestation less than 28 weeks, any anomalies to the fetal central nervous system regulation of the heart rate, and hypoxia that is severe enough to affect the central nervous system. So a lack of variability should prompt a healthcare worker to further investigate to determine fetus condition. Beat-to-beat or short-term variability is describes as the oscillation of the FHR around the baseline in amplitude of 5 to 10 bpm. Long-term variability is a somewhat slower oscillation in heart rate and has a frequency of three to 10 cycles per minute and an amplitude of 10 to 25 bpm. Clinically, loss of beat-to-beat variability is more significant than loss of long-term variability and may be ominous. The National Institutes of Health (NIH) consensus panel decided to make no distinction between short-term variability (beat-to-beat variability) and long-term variability. The panel felt that in clinical situations, both short-term and long-term variability are taken as a unit to represent overall variability. The reader should be aware that, when needed for clinical management, short-term variability and long-term variability are recorded accurately only when a fetal scalp electrode (FCE) is being used. When external Doppler techniques (external monitoring) are used to obtain the fetal heart rate, several heartbeats are averaged (the number depends on the manufacturer of the fetal heart rate monitor). In the 2015 FIGO system the CTG patterns are classified as normal, suspicious and pathological, and it is a 3-tier classification. 4-tier system is also used, if the pre-terminal CTG pattern (totally absent variability and reactivity, with or without decelerations and bradycardia) is regarded a separate class and not included in the pathology class under “reduced variability”. (Fig. 74) Variability, therefore, is defined as fluctuations in the baseline FHR of two cycles/minute and is classified as: Normal 5 - 25 bpm Reduced (undulating, sinusoidal pattern) < 5 bpm Absent (monotonous, linear) < 2 bpm Increased (saltatory pattern) > 25 bpm Рис. 74. Normal variability. Variability of baseline FHRincreased and shown in a separate window. Reduced (Sinusoidal pattern) is a regular, smooth, undulating pattern resembling a sinus wave, with amplitude 5-15 bpm at frequency 3-5 cycles/min, lasting for > 30 min and coinciding with absent accelerations. (Fig. 75) Reasons: 1. severe hypoxia; 2. severe anemia; 3. Rh-incompartibility; 4. Terminal status of the fetus. Fig. 75. Sinusoidal (undulating) pattern of a FHR variability. Absent (Monotonous) pattern (Fig. 76) usually appears as a result of: • the compression of the inferior vena cava syndrome; • CNS malformations of the fetus; • deep intrauterine distress of the fetus (affecting the central nervous system of the fetus), terminal status of the fetus. Fig. 76). Absent (monotonous) pattern of FHR variability. Increased variability (saltatory pattern) in the baseline FHR is present when the oscillations exceed 25 bpm (Fig. 77). It is bandwidth > 25 bpm for > 30 min. Increased variability is usually caused by acute hypoxia or mechanical compression of the umbilical cord. This pattern is most often seen during the second stage of labor. The presence of a saltatory pattern, especially when paired with decelerations, should warn the physician to look for and try to correct possible causes of acute hypoxia and to be alert for signs that the hypoxia is progressing to acidosis. Fig. 77. Saltatory pattern with wide variability. The oscillations of the fetal heart rate above and below the baseline exceed 25 bpm. As conclusion: interpretation of fetal heart rate patterns can be described as follows (Table 6). Table 6

|
|
|