 |


IELTS Writing Task 1: Слова-связки для графика
|
|
|
|
IELTS Writing Task 1: Слова-связки для графика
Чтобы получить 6. 0-7. 5 и выше тебе нужно эффективно соединять свои идеи.
Это умение оценивается экзаменатором, т. к один из критериев оценки Coherence/Cohesion, т. е последовательность и связность/целостность.
Сколько этих слов нужно писать?
Достаточно; их должно быть не много и не мало. слова связки как сахар или соль: переложешь – будет слишком сладко или слишком солёно.
Так что берём слова связки и посыпаем ими то, что пишем.
Как эффективно начать параграф:
- According to the graph/figures …
- It is clear that …
- It can be seen that …
- It is noticeable that...
Вот слова, которые помогут соединять ваши идеи:
Contrast words
- In contrast
- However
- whereas/while
- On the other hand
Linking phrases
- In addition
- Furthermore
- Overall, it could be seen that...
- According to the data...
- It is clear that...
Time expressions
- in the year 2000
- at the end/beginning of the period
- over/throughout/during the period in question
- by 2000
- between 1998 and 2000
The last Paragraph:
- Overall,
- To sum up,
| ДЛЯ ПРОЦЕССА ВОТ ЭТИ: The first step is that … Firstly, Secondly, Finally Next, The following step is that… The next step it that … After this, Following this, … At the first stage... | 
|
| ДЛЯ КАРТ: According to the map, … Another notable development … One more striking change … It is clear that the principal change... Looking at the map in more detail it can be seen that... | 
|
IELTS Writing Task 1: Структура и шаблон описания графика
В IELTS WRITING TASK 1 разные графики:
- Line graph
- Bar chart
- Tables
- Pie charts
- Process
- Life cycle
- Maps
- Mixed type: line graph + table ИЛИ pie chart and line graph
Подробнее о том, какие графики бывают в IELTS Writing Academic
СТРУКТУРА ОДНА ДЛЯ ВСЕХ ВИДОВ ГРАФИКОВ:
4-5 параграфов
150-170 слов
1§ Introduction: Paraphrase the Task (1 sentence)
- The graph gives information on … between … and …
- provides data on … over a 10-year period from … to …
- illustrates …
2§ Main features with Comparisons
3§ Main features with Comparisons
4§ Main features with Comparisons – ЭТОТ ПАРАГРАФ НЕ ОБЯЗАТЕЛЬНО
5§ Overall statement (general trend / what’s the same and what’s different)
|
|
|
Overall statement – можно написать во втором § и структура будет выглядеть вот так:
1§ Introduction: Paraphrase the Task (1 sentence)
2§ Overall statement (general trend/what’s the same and what’s different)
3§ Main features with Comparisons
4§ Main features with Comparisons
5§ Main features with Comparisons – ЭТОТ ПАРАГРАФ НЕ ОБЯЗАТЕЛЬНО)
Первый вариант: от деталей к общему (overall statement)
Второй вариант: от общего (overall statement) к деталям
И так и так можно.
В основной части может быть 2 или 3 параграфа.
Задания IELTS Academic Writing Task 1: графики, карты, процессы и диаграммы
В первой части IELTS Academic Writing Вам могут попасться разные виды графиков: линейный график, таблица, карта, процесс, два графика или две таблицы.
Вы подбираете слова и грамматические конструкции в зависимости от вида графика о котором пишите. Например, если вам достался процесс (круговорот воды на Земле) вы используете такие слова как: first, following this, the next stage, then … etc. Для таблицы такие слова – не самая удачная идея.
1. Bar Chart (Столбчатый график)
You should spend about 20 minutes on this task.
The bar chart shows the global sales (in billions of dollars) of different types of digital games between 2000 and 2006.
Summarise the information by selecting and reporting the main features, and make
comparisons where relevant.
Write at least 150 words.
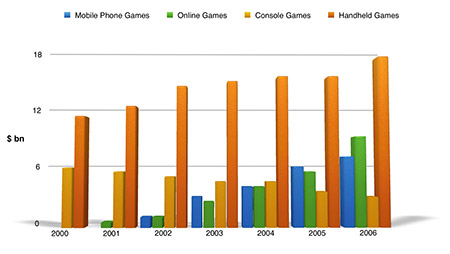
В задании изменяется только та часть, которая жирным шрифтом.
|
|
|